Scenario Outlook
Part of Retail sustainability claims
Reporting uncertainty in retail sustainability comparisons
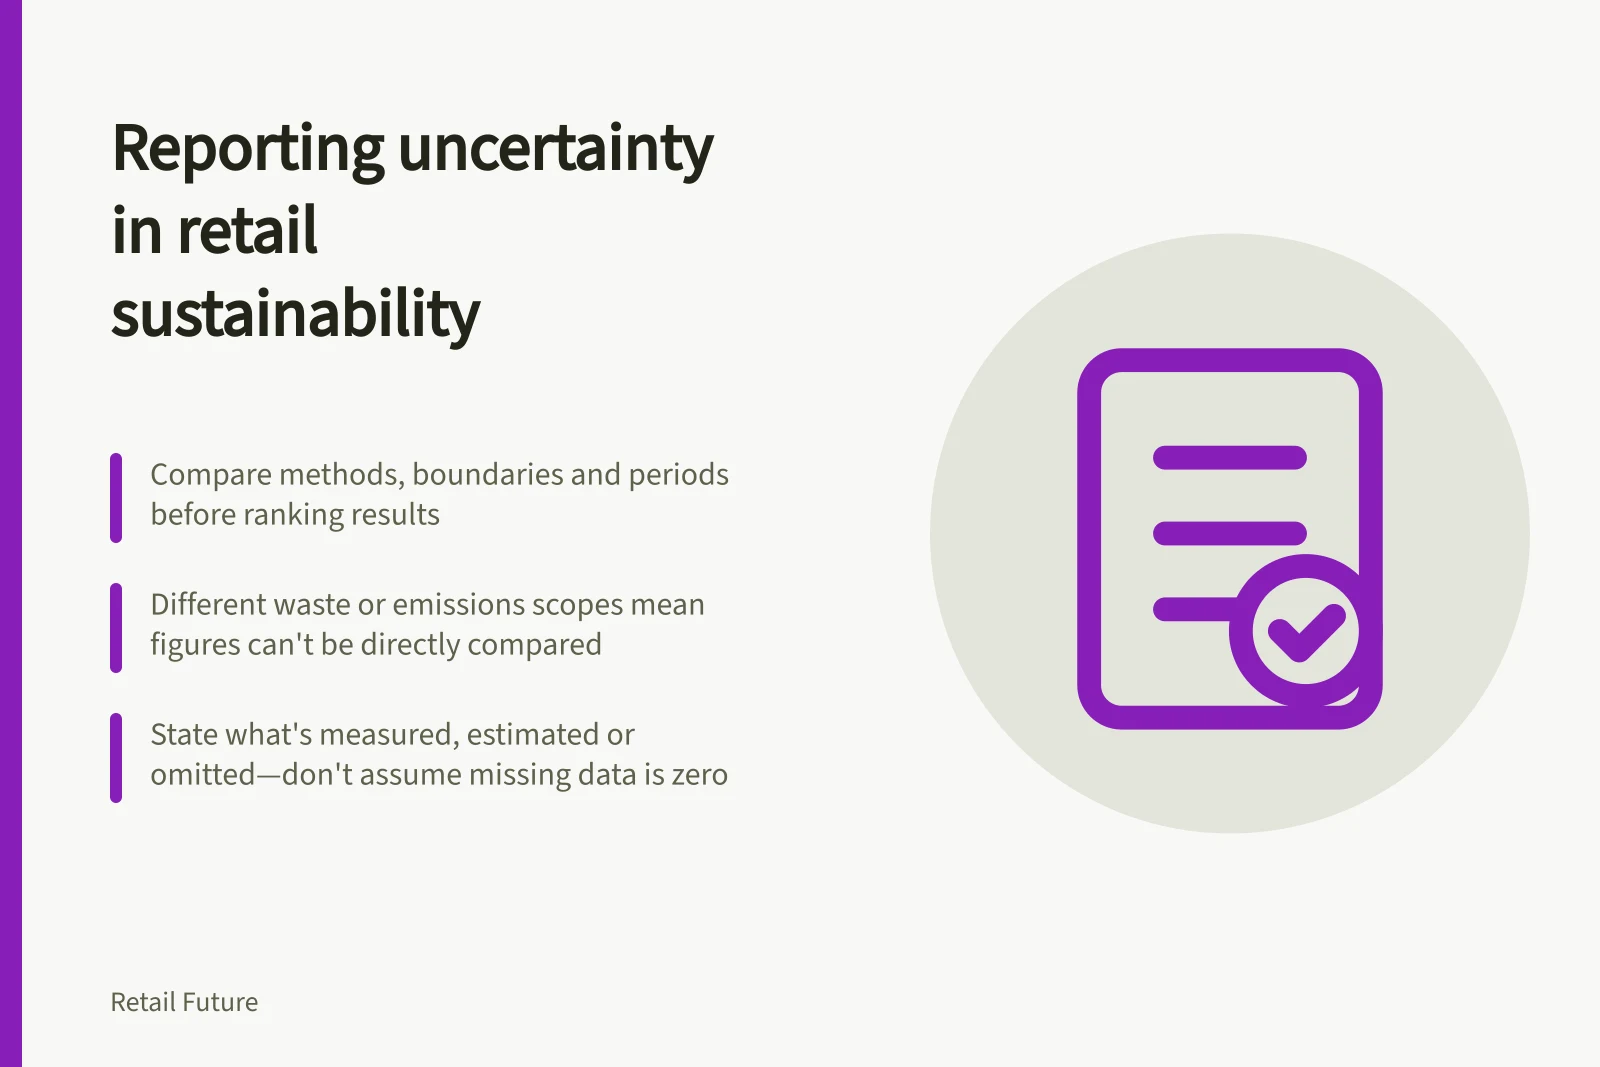
Report differences in boundaries, denominators, years and estimates before comparing retailers' published environmental results.
When two retailers publish different sustainability measures, describe those differences before comparing results. A precise percentage can still be unsuitable for comparison if one figure covers Australian stores and another covers a whole group, or if their waste and emissions methods differ. The defensible result may be two bounded observations rather than a ranking.
Decide whether the figures answer the same question
For each retailer, record the measure, unit, included businesses, geography, reporting period, baseline and method. For waste, add the material stream and destination. For emissions, add the covered scopes and categories, calculation basis and any stated use of carbon credits. Align these fields before calculating a gap or change.
| Difference found | Reporting response |
|---|---|
| Different business or geographic boundaries | Describe each result separately; do not present the figures as a whole-business comparison. |
| Different denominators | Show the numerator and denominator for each figure; avoid comparing percentages alone. |
| Different reporting years | Date both results and avoid implying simultaneous performance. |
| Different estimated-data coverage | State the method and affected categories or share if disclosed. |
| A measure or baseline was revised | Use a restated series where available; identify a break that cannot be reconciled. |
A missing disclosure is an unknown, not a zero. A national waste figure describes its own population and cannot stand in for a missing company result.
Name the source of uncertainty
Greenhouse gas figures may combine direct measurements, activity data and emission factors, or broader estimates. A reported total may be useful while the quality of its component data varies.
For packaging, a component’s recycling classification describes a route under stated conditions. It does not establish how much material was actually recycled. Comparing that classification with another retailer’s tonnes recovered would compare an assessed possibility with a reported flow. Keep the two measures separate.
A reported reduction may also reflect improved measurement, a revised base year or a different set of stores. Check whether the publisher explained the change and restated earlier figures. Without that account, a trend inferred from the two observations is less secure.
Critical Elements to Verify Before Comparing Retail Sustainability Data
- GHG Calculation Basis
- Direct measurements, activity data, emission factors, or estimates
- Packaging Recycling Classification
- Route under stated conditions; not actual tonnes recycled
- Waste Recovery Reporting
- Material stream and destination must be specified
- Baseline Year Consistency
- Check for revisions and restated figures
Write the conclusion at the supported level
Where one result covers Australian stores and another covers a group in a different period, identify each boundary and say that the figures do not support a direct performance ranking. Where boundaries match, report the measured difference and any remaining limits in estimation or coverage.
Do not invent a numerical confidence interval when the reports provide no basis for one. Naming what was measured, estimated and omitted lets readers use the evidence without mistaking a difference in disclosure for a difference in environmental performance.