Retail Economics
Part of Retail business economics
Reading inventory turnover alongside product availability
Calculate inventory turnover, read it beside product availability and avoid mistaking fast stock movement for reliable customer service.
Inventory turnover compares the cost of goods sold over a period with average inventory held on a compatible cost basis. Product availability asks whether customers could buy the intended items where and when they needed them. Read the two together: faster turnover is useful only if the stock position still supports the intended offer.
Calculate turnover on a compatible basis
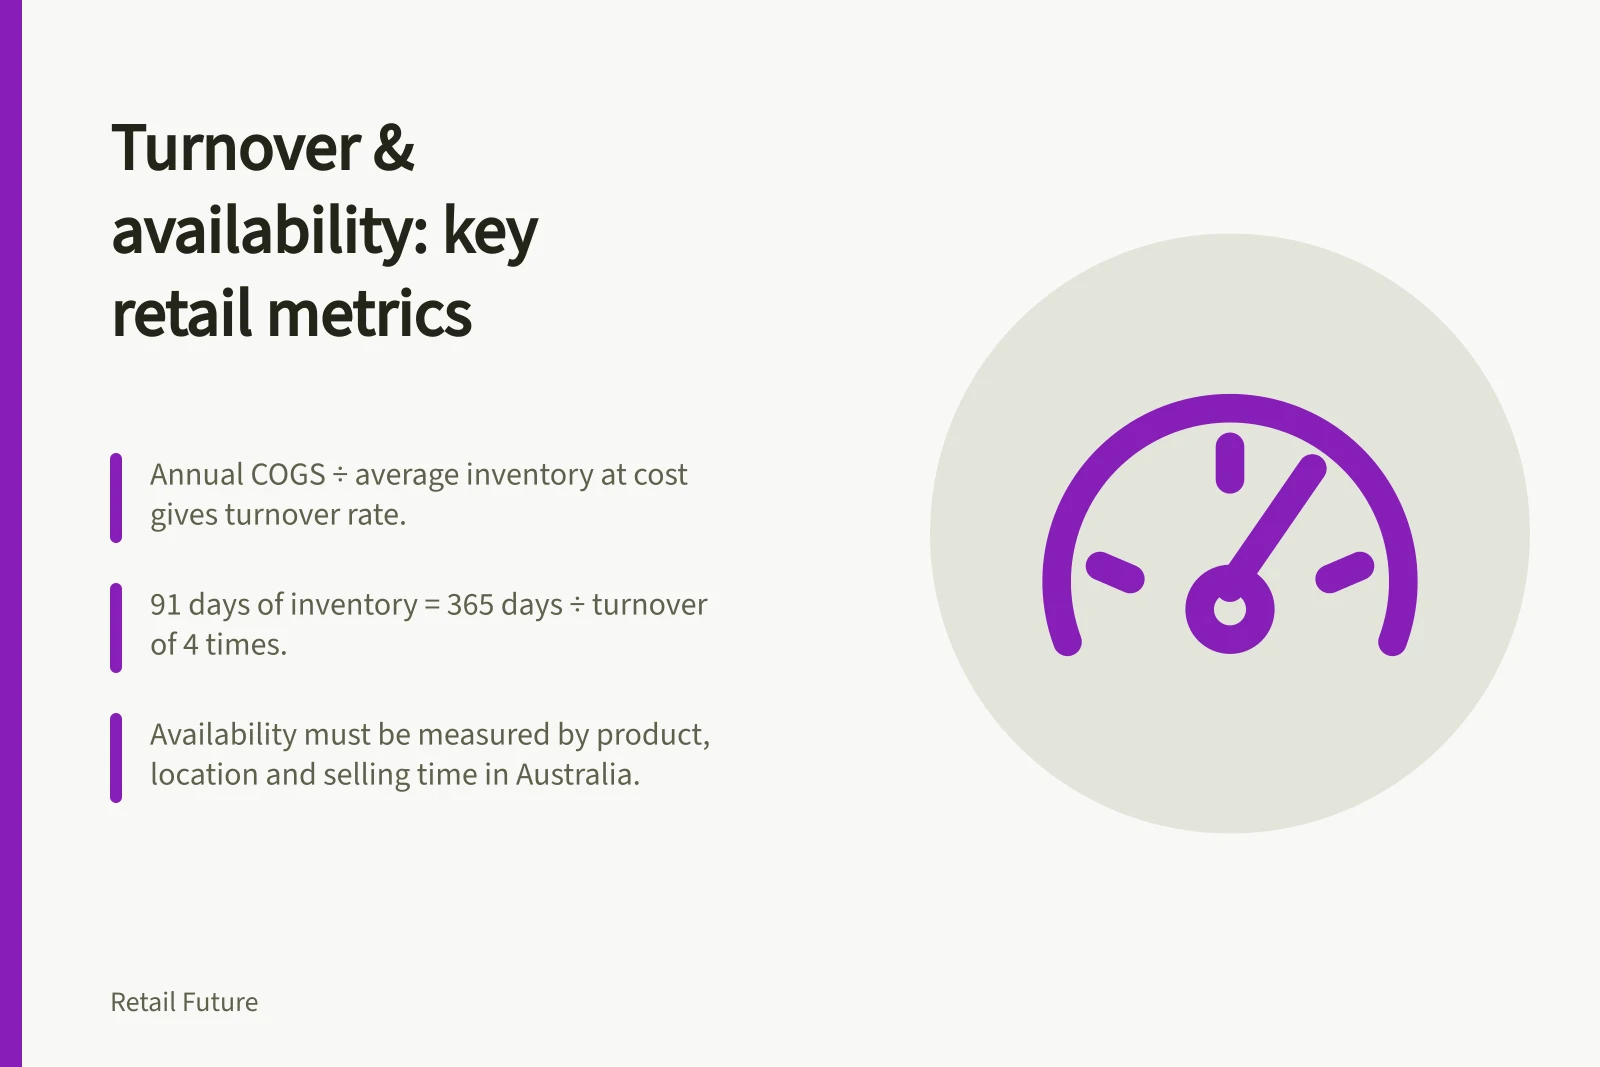
For a year, a common management calculation is annual cost of goods sold divided by average inventory value at cost. If an invented retailer has $600,000 in annual cost of goods sold and $150,000 in average inventory, turnover is four times.
Dividing 365 days by four gives about 91 days of inventory under this simplified calculation. That is an aggregate average, not a promise that each item sells within 91 days.
Specify the inventory dates and averaging method. A simple average of opening and closing balances can mislead a seasonal business; more frequent observations may better represent stock held through the year.
Check whether cost of goods sold and inventory cover the same products, locations and ownership boundary. Sales revenue divided by inventory recorded at cost would mix valuation bases.
Measure availability where customers buy
An inventory balance can include goods held away from a store. A product may be owned by the retailer yet unavailable in the size, shop or fulfilment area where a customer needs it.
The Australian Bureau of Statistics’ Business Indicators publication contains estimates of the book value of inventories for selected industries in Australia. That aggregate cannot measure shelf availability.
For an internal review, define availability for particular products, locations and selling periods. One possible measure is the share of relevant product-and-location selling hours when an order could be placed and fulfilled.
State whether it checks shelf stock, online promise stock or both. An average across every product can hide gaps in the items customers seek most often, so inspect important products separately.
Record unfilled requests, cancelled orders and substitutions where observable. A purchase that never occurred will not appear in cost of goods sold. Turnover may therefore look healthy while unmet demand is missed. These records can indicate a service problem but do not yield an exact lost-sales figure without further assumptions.
Interpret the pair
| Turnover | Availability | Useful next question |
|---|---|---|
| Rising | Stable or improving | Did replenishment improve without adding avoidable cost? |
| Rising | Falling | Are popular products running out before the next delivery? |
| Falling | Stable | Is extra stock deliberate cover for a season or a slower supply route? |
| Falling | Falling | Is stock held in the wrong products or locations? |
These are prompts, not conclusions. Product mix, purchase costs, markdowns and receipt timing can change turnover. Availability can fall because stock is in transit, allocated elsewhere or recorded inaccurately. Check product and location records before assigning a cause.
Decide what to change
Identify the products behind the availability gap and those accounting for average inventory; they may differ. Review sales while items were available, replenishment dates and remaining selling windows. A faster reorder may help a steady seller but create waste for a short-season item that arrives late.
Report the turnover period, inventory basis and availability definition together. If only a company-level or industry inventory value is public, keep the conclusion at that level. It cannot establish that a particular store had too much stock or that customers could find every product they wanted.