Market Analysis
Part of Retail outlook and scenario analysis
Reviewing what a past retail forecast got wrong
Audit a past retail forecast against a matched outcome, calculate its error and identify which assumptions need to change.
Review a past retail forecast by comparing the prediction as issued with an outcome on the same measure and date. Calculate the gap before explaining it. Later information can help diagnose the miss, but do not write it into the original forecast.
Retrieve the forecast as issued
Record its publication date, target period, category or business, geography, price basis, exact metric and any stated conditions. Keep its point prediction or range. A national household spending forecast cannot be scored against one retailer's revenue; a sales-dollar prediction cannot be scored against item counts.
Find the first suitable outcome release and its publication date, then retain the latest available revision. The first version shows what a reader could have known when the result appeared; the latest shows what the series currently reports.
Estimates in a statistical series can change between the first release and later versions, so record which version the comparison uses.
Key Data Releases and Forecast Timeline
- 2025First Release of Retail Trade Data (June ) — 30 June 2025
- 2025ABS Retires Retail Trade Series
- 2025Monthly Household Spending Indicator (MHSI) Launched
Calculate the error first
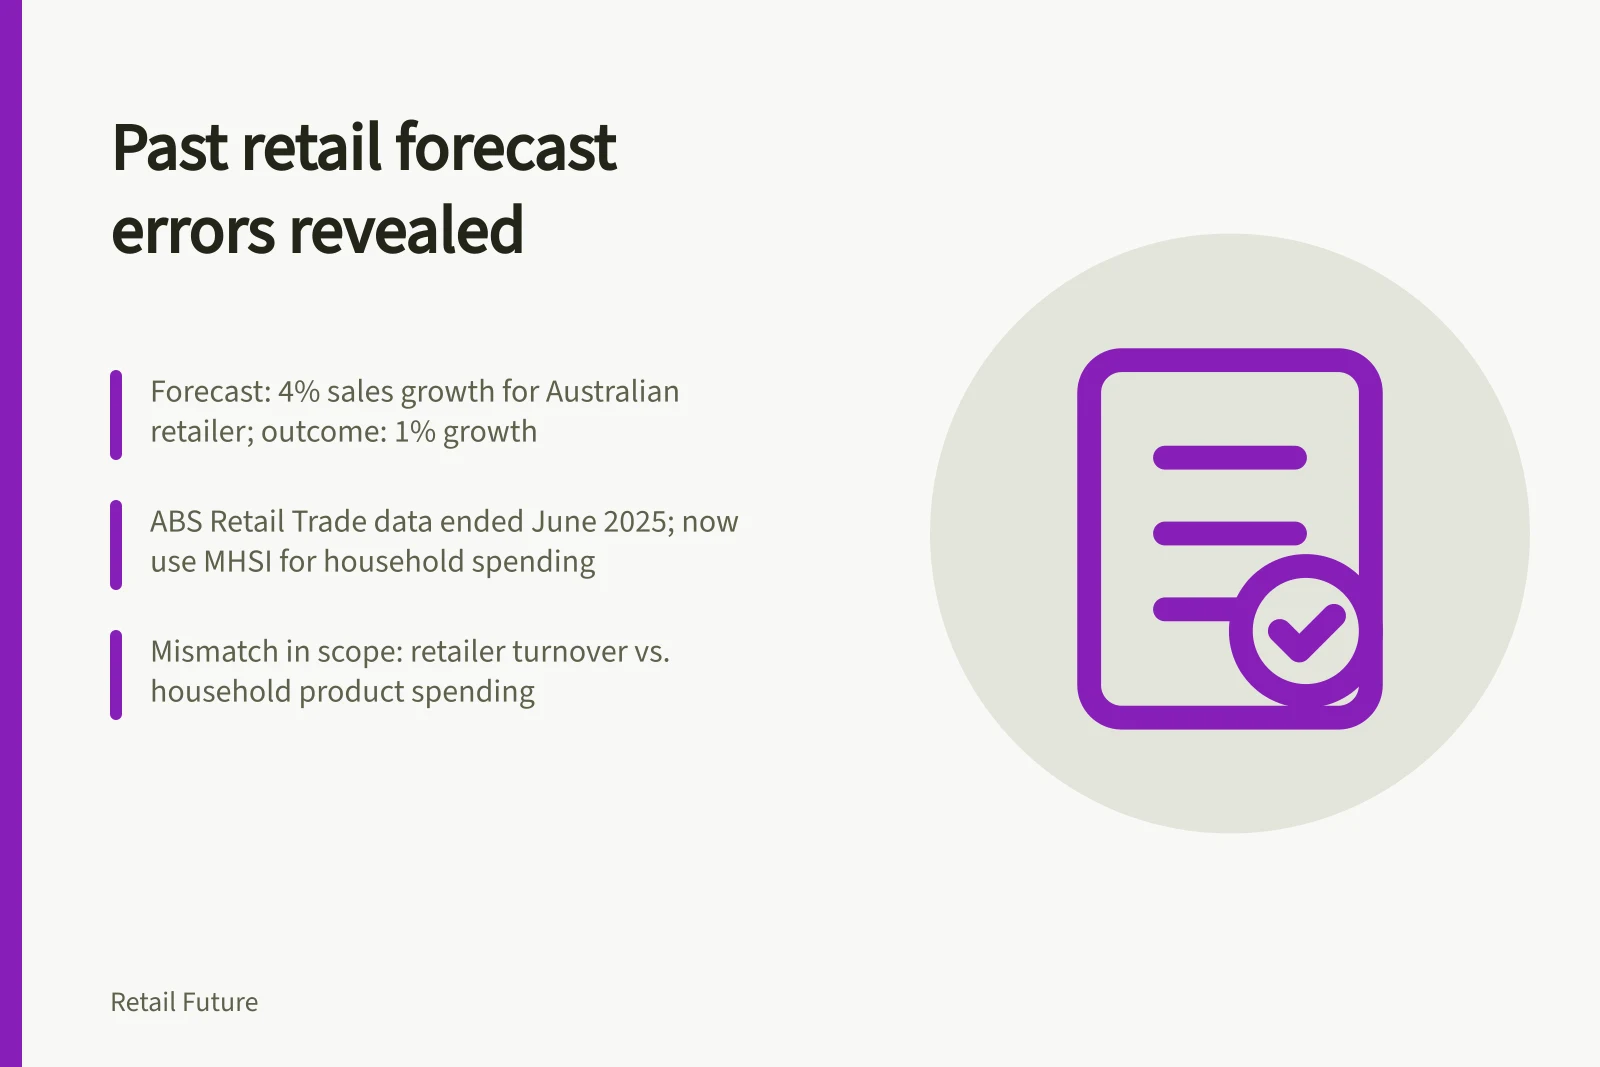
For a worked arithmetic example, imagine a forecast made before a year began: sales for a defined Australian retail business would grow 4% that year. Its later report, using the same sales boundary, showed 1% growth. The forecast was three percentage points above the outcome. Both figures are hypothetical; they do not describe a real retailer.
Review field / Hypothetical record
- Forecast
- Sales growth of 4% for the stated year
- Matched reported outcome
- Sales growth of 1% on the same definition
- Direction and size of error
- Forecast exceeded outcome by 3 percentage points
- Cause established by the error alone
- None
For an original forecast range, report whether the outcome fell inside it and, if it did not, how far outside. Do not judge the range solely by its midpoint. If the sales definition changed, document a defensible reconciliation or leave the figures separately labelled.
Forecast Accuracy Metrics
- Direction of Error
- Over-predicted
- Outcome within Forecast Range?
- No
Test assumptions against later evidence
Return to the assumptions actually recorded with the forecast. Did it depend on selling prices, unit demand, an opening, reliable stock or a promotion calendar? Mark conditions that occurred, failed or were never measured. Identify relevant events outside the original plan.
Avoid assigning the whole miss to the first visible change. A sales shortfall may involve prices, mix, availability, trading days and demand. A delayed opening may reduce trading weeks, but its precise contribution requires suitable store results. Where the evidence cannot separate effects, report plausible contributors and the unexplained remainder.
For an Australian market forecast, check the statistical series before calculating error. The ABS ceased Retail Trade, Australia after the June 2025 reference period. Monthly statistics on household spending have transitioned to the Monthly Household Spending Indicator (MHSI), which is derived using bank transactions, supermarket transactions and new vehicle sales data. Its scope varies from the Retail Trade turnover estimates for retail businesses. Joining the series without a method check can create a misleading comparison. Household product spending and retailer-industry turnover are different measures.
Challenges in Comparing Forecast to Outcome
- ProsABS MHSI provides real-time transaction data; better for tracking household spending trends.
- ConsRetail Trade series ended after June 2025; direct comparison with pre-2025 retail turnover data is not valid.
Use the finding next time
Close the audit with what was predicted, what was observed, the size and direction of the gap, which assumptions failed, what remains unknown and what decision rule should change.
A wider range, separate supply scenario, earlier review trigger or better matched outcome measure may address a diagnosed weakness. One missed forecast does not establish that all future forecasts will fail; it shows where this forecast and the decision that used it were vulnerable.