
Shopper Research
Interpreting published retail shopper research
Read Australian shopper surveys and spending research with the right population, question, period and limitations before applying a finding.
A published shopper finding answers a question about a particular group at a particular time. Before using it for a retail decision, check who supplied the evidence, what people were asked or observed doing, and how widely the result can reasonably apply.
Start with the claim’s unit
A percentage might describe survey respondents, customers of one retailer, online shoppers, transactions or households. Those groups are not interchangeable. Nor do “preferred”, “intended to buy” and “bought” describe the same action. Record the denominator and question beside any figure you plan to use.
The ACCC received 21,481 responses to its consumer survey, conducted from 29 February to 2 April 2024 to better understand how consumers engage with supermarkets. The response count alone does not establish that every percentage is an estimate for all Australian shoppers.
Key Statistics from Australian Retail Research
- ACCC Consumer Survey Responses
- 21,481
- ABS Monthly Household Spending Indicator Coverage
- Bank transactions, supermarket aggregates, vehicle sales data
- ABS Data Adjustments for Coverage Gaps
- Includes benchmarking to annual household final consumption expenditure
Read the method before the headline
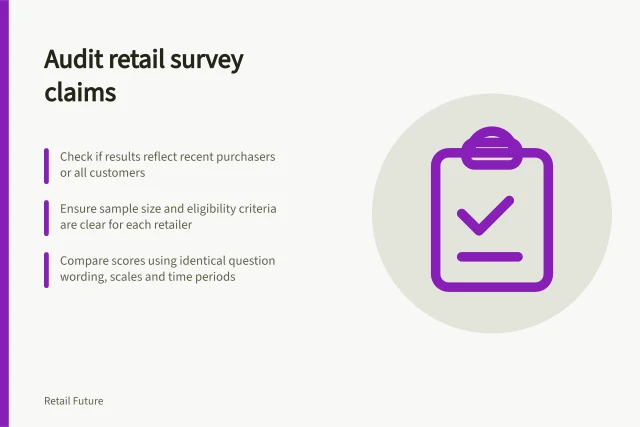
For a survey, check recruitment, eligibility, field dates, question wording, answer options and the number who answered the particular question. If people could choose several answers, the percentages need not add to 100. A subgroup may have a much smaller base than the full survey. Weighting can improve alignment with a target population, but it cannot resolve every coverage, non-response or wording problem.
For spending data, ask which transactions and payment types are included. The Australian Bureau of Statistics’ Monthly Household Spending Indicator uses bank transactions, supermarket transaction aggregates and vehicle sales data, with adjustments for coverage. Its published aggregates cannot identify an individual shopper’s motive. A spending movement can inform a market question without answering why someone bought something.
| Published evidence | Useful reading | Question left open |
|---|---|---|
| Shopper survey | What eligible respondents reported | Whether they later acted the same way |
| Satisfaction rating | How surveyed customers rated an experience | Which part of the service shaped the rating |
| Transaction aggregate | What spending was recorded within its coverage | Why a buyer chose the purchase |
Keep the finding in its setting
Record the retail category, geography, channel and collection period. A grocery-store choice finding may not fit a furniture purchase. An online delivery preference may not describe an in-store visit. Results collected during a promotion may differ when the offer changes.
Check the publisher’s purpose and the available method. A retailer, delivery provider, regulator and survey organisation may ask different questions and disclose different levels of detail. A short summary can also omit qualifications in the underlying report.
Distinguish error types
The Australian Bureau of Statistics distinguishes sampling error from non-sampling error. Sampling error arises because a survey uses a sample rather than a complete count; it can also occur when the sample is too small or its characteristics do not reflect the population.
Non-sampling error can arise at different stages and is not easily identified or quantified. The ABS includes coverage problems, non-response and inaccurate answers among its examples; respondents may misunderstand a question, have difficulty recalling details or give an answer they think is more socially acceptable.
Use these distinctions to qualify the claim, not just the headline percentage. A result may be affected by who was reached, who chose to answer, or how respondents understood the question. If the report does not give enough detail to assess a possible limitation, record that uncertainty rather than treating it as resolved.
Read spending claims within their boundaries
The ABS describes the Monthly Household Spending Indicator as measuring final consumption by Australian households, with data drawn from participating banks, supermarkets and new vehicle sales. Its concept is aligned as closely as possible with household final consumption in the National Accounts, but the ABS notes that the underlying sources do not capture every part of that concept.
For example, the indicator’s bank transaction data exclude foreign-currency transactions where the card terminal is outside Australia. Its sources also do not capture Australian residents’ spending on goods and services offered outside Australia, or expenditure by resident non-profit institutions serving households. A published movement should therefore be read as a movement within the measure’s coverage, not as a complete account of every kind of household expenditure.
The ABS benchmarks the indicator to annual household final consumption expenditure and adjusts monthly data for gaps such as cash spending. It also references consumption to when the good or service is consumed, rather than when it is paid for, when those periods differ. That distinction matters when comparing a spending claim with a shopper’s account of when they made a purchase.
Translate evidence into a decision carefully
A published finding about a reason for choosing a grocery store could prompt a retailer to examine the relevant customer experience. It does not establish how every customer would respond to a change or predict sales.
A useful decision record states the finding, population and period, plausible interpretation, and evidence still needed. For example, a stated preference for convenient collection could prompt a check of local demand and actual collection use. It would not, by itself, justify a network-wide service change.
When newer research appears, check whether successive publications asked comparable people the same question in comparable ways. If they did not, report the findings separately rather than calling the difference a trend.
Timeline of Key Retail Research Publications (Australia)
- 29 February2 April 2024 — ACCC consumer survey on supermarket engagement
- August 2026ABS Monthly Household Spending Indicator methodology update
- 2025KPMG Australian Retail Outlook 2025 report
In this guide
- Checking the sample behind a retail satisfaction surveyLearn which sample, eligibility, response and question details matter before comparing published retail satisfaction scores.
- Comparing convenience and price findings in shopper studiesUnderstand when shopper studies can compare convenience with price or value, and when question wording makes the figures incompatible.
- Tracking how published retail service expectations change over timeCompare retail service expectations across reports by matching questions, shopper groups and field dates before claiming a trend.