Shopper Research
Part of Interpreting published retail shopper research
Tracking how published retail service expectations change over time
Compare retail service expectations across reports by matching questions, shopper groups and field dates before claiming a trend.
To test whether a delivery expectation has changed, compare answers to the same question across periods, using comparable response options and shopper groups. A shift in priorities, satisfaction or delivery performance does not by itself demonstrate a shift in expectations.
Define the expectation first
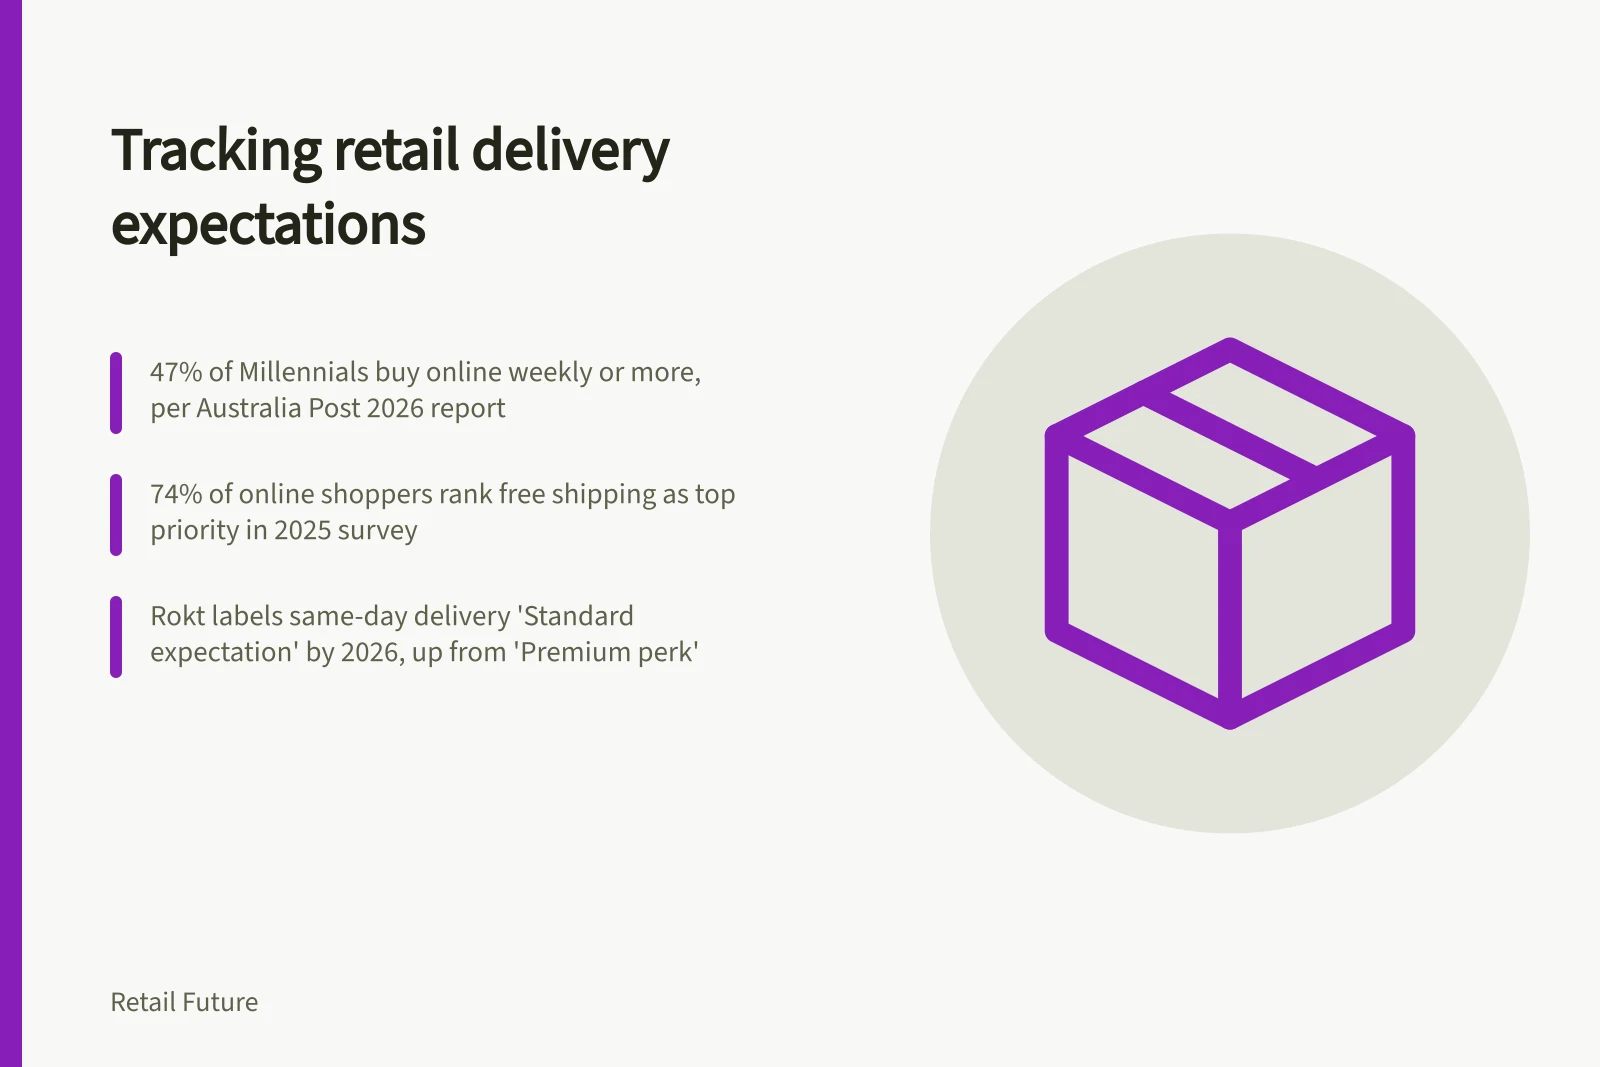
Australia Post’s 2026 eCommerce report page gives behaviour indicators, including 47% of Millennials buying online weekly or more, compared with 35% of shoppers overall. It also reports marketplace apps at 69% and retailer websites at 78%; these are activity measures, not delivery expectations.
Rokt’s 2020-versus-2026 table labels free shipping a ‘Strong differentiator’ and then ‘Table stakes’, and same-day delivery a ‘Premium perk’ and then a ‘Standard expectation’. The labels suggest a shift, but the excerpt gives neither repeated question wording nor paired percentages for those years, so they do not establish a measured trend.
A separately described 2025 Digital Commerce 360/Bizrate Insights survey reports that 74% of online shoppers ranked free shipping as their top priority when deciding where to shop, ahead of delivery speed and every other factor surveyed. That single priority result is not a before-and-after measure of expectations.
Key Online Shopping Trends in Australia
- 47%Millennials buying online weekly or more
- 69%Shoppers using marketplace apps
- 78%Shoppers using retailer websites
- 74%Top priority for % of shoppers — Free shipping
Build a comparison record
For each publication, record the field dates, exact question and answer choices, target population, sampling and weighting, channel, geography, denominator and any reported uncertainty. Note changes to the survey provider or to a definition such as ‘online shopper’; differences on these points weaken a comparison.
Item to hold steady / Why it matters
- Question and answer scale
- “Top priority” and “would like” measure different strengths of preference.
- Eligible shoppers
- All adults and recent online buyers may answer differently.
- Collection season
- A peak-delivery period may affect what respondents have in mind.
- Service condition
- Urgent orders differ from ordinary orders.
- Reported base
- A subgroup may be much smaller than the full sample.
The Australian Bureau of Statistics explains that standard error measures variation between an estimate and the true population value, while relative standard error expresses that error as a proportion of the estimate. Published relative standard errors can help compare estimates from different studies of the same population; a 95% confidence interval is commonly about two standard errors either side of an estimate under a normal distribution.
For a delivery comparison, keep Rokt’s status labels separate from the 2025 free-shipping priority result unless question wording, response options, population and collection periods are comparable. If only the published descriptions differ, report that difference without presenting it as a settled change in shopper expectations.
Published Retail Service Expectation Changes Over Time
- 2020Rokt report — Free shipping: Strong differentiator; Same-day delivery: Premium perk
- 2026Australia Post eCommerce report — 47% of Millennials shop online weekly or more
Keep satisfaction and service performance separate
Roy Morgan’s ongoing Single Source survey in Australia collects customer satisfaction ratings and supplies data for its monthly and annual Customer Satisfaction Awards. Roy Morgan gives an annual example of over 60,000 consumers and 12,000 business decision-makers; these ratings measure satisfaction, not stated delivery expectations.
Parcel-arrival records show when deliveries occurred, but not what customers expected or whether their expectations changed.
Keep stated delivery expectations, satisfaction after delivery and actual parcel performance as separate measures. A change in one does not establish a change in the others.