Market Analysis
Retail category research
Define a retail category, choose suitable Australian data and assess purchase behaviour before drawing a market conclusion.
Retail category research starts with a product or shopping decision: what is bought, by whom, and what evidence would change the decision. Define the category before choosing a figure. Household spending on products and turnover at businesses classified as retailers answer different questions.
Define the category around the decision
For a range decision, specify the products and customer task—for example, ingredients for meals at home. For a question about supermarket businesses, use an industry measure and keep its business boundary visible. Supermarkets sell more than food, and households buy food from other businesses too.
Describe how the purchase arises. Is it routine replenishment, replacement after wear or failure, a planned project, or an occasional purchase? Can customers delay it, buy ahead or choose a substitute? Investigate these questions for the particular product and customer, not as fixed labels for an entire category.
| Decision question | Evidence to seek | Remaining limit |
|---|---|---|
| Is household spending on the product group changing? | A consistently defined product spending series | Which retailer received the spending |
| Are businesses in an industry trading differently? | Turnover for a defined retailer group | Which products drove the movement |
| Are customers buying more units? | Suitable unit or price-adjusted volume evidence | How the product mix changed |
| Is a retailer meeting demand? | Its sales, availability and unfilled requests | Demand outside its recorded channels |
Household Spending vs. Retailer Turnover: Different Questions, Different Measures
- Household Spending (MHSI)Measures what Australian households spend on products for personal use; based on de-identified transaction data from bank cards, supermarkets and vehicle sales.
- Retailer Turnover (ANZSIC)Measures total sales by businesses classified as retailers; includes all goods sold, regardless of whether the household is resident or not.
Separate reported behaviour from measured spending
Purchase-behaviour evidence can help explain a category movement, but record what respondents were asked. Monash University’s Australian Consumer and Retail Studies pulse survey asked shoppers how their purchasing habits had changed since the corresponding time a year earlier. In 2024, 57% reported spending more on groceries than a year earlier.
That result is a reported change in spending, not a count of grocery units or a measure of sales at a particular retailer. The same survey found 69% felt groceries and grocery-related products cost more than at the corresponding time the previous year. Keep reported perceptions distinct from measured prices and spending when deciding what the evidence can support.
Key Household Spending Trends in Australia (Aug 2026)
- 57%% of shoppers reported spending more on groceries than a year earlier — 2024 survey result
- 69%% felt groceries cost more than 12 months prior — 2024 survey result
- $100Average $70–$80 spent on food per in supermarkets — ABS estimate (Aug 2026)
Choose an Australian measure
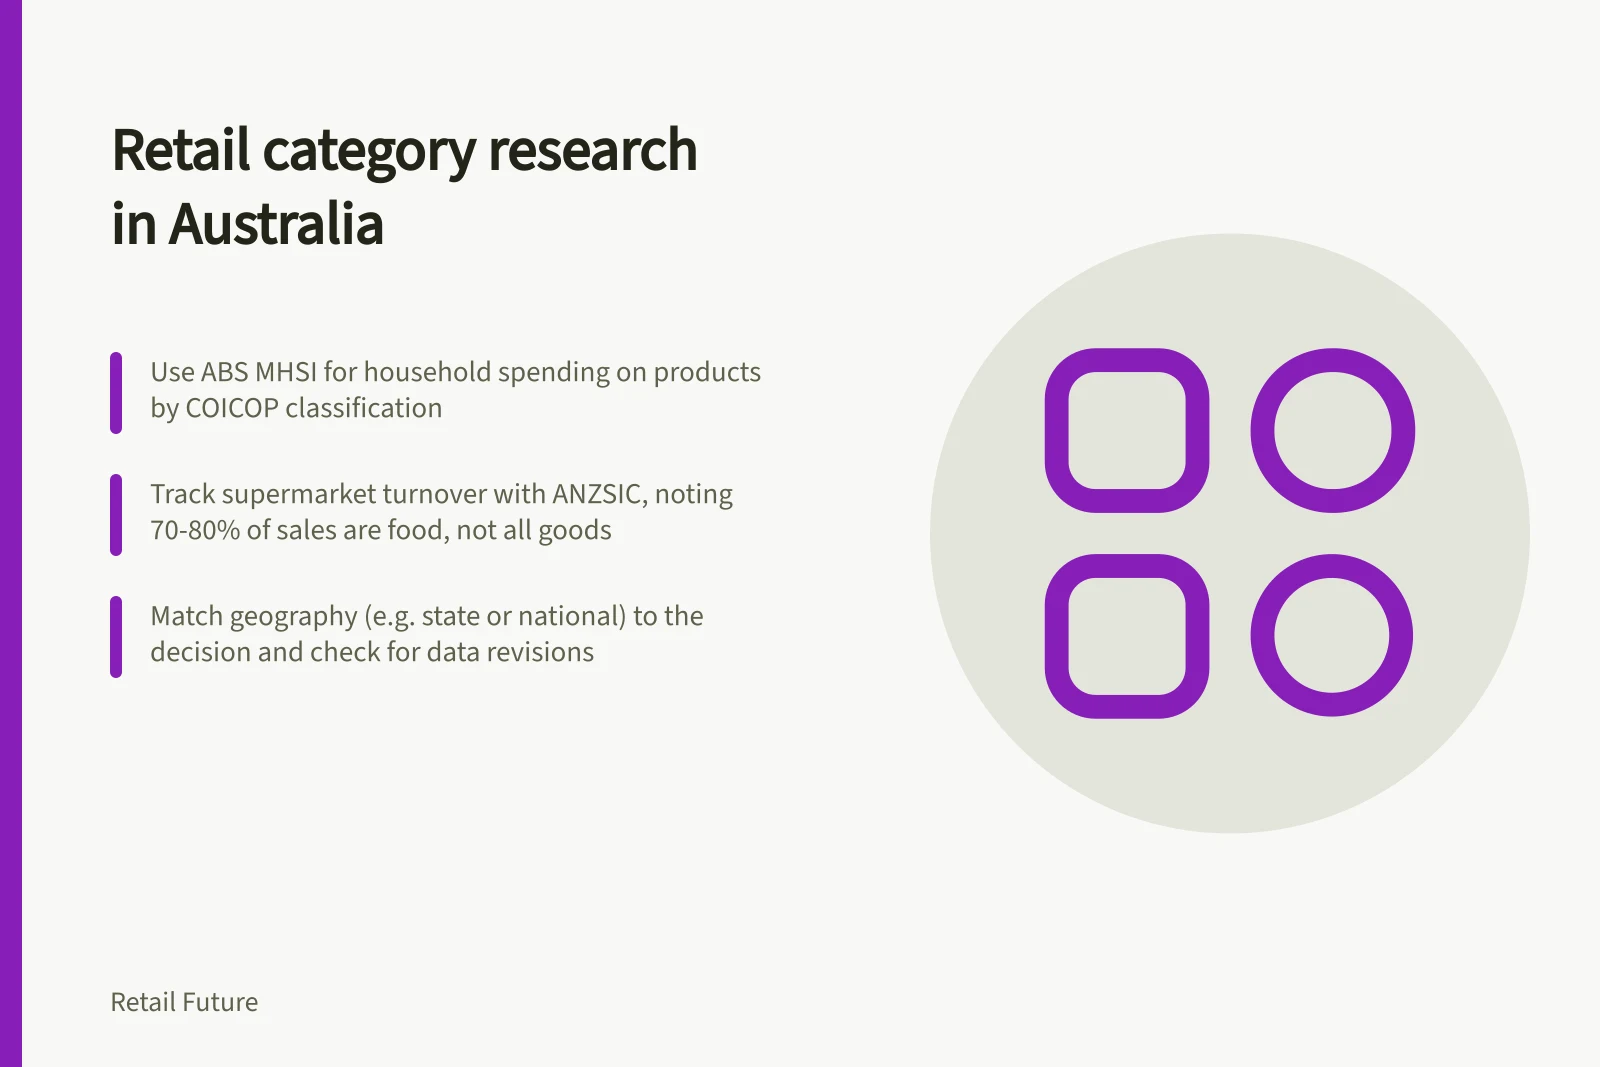
The Australian Bureau of Statistics (ABS) Monthly Household Spending Indicator (MHSI) provides a view of spending by product using the COICOP classification. The Monthly Business Turnover Indicator provides an industry view of business turnover using ANZSIC. Choose the measure whose boundary fits the decision; product spending and business turnover answer different questions.
The former Retail Trade, Australia publication ended with the June 2025 reference period. Identify the series used in any historical chart, especially where it crosses that boundary.
Key Data Releases and Reporting Periods (2024–2026)
- 2026Monthly Household Spending Indicator (MHSI) – Aug — Latest release available
- 2025Retail Trade, Australia – June — Final publication before discontinuation
- 2024Monash University Consumer and Retail Studies Pulse Survey – — Survey on changing shopping habits
- 2022ACCC Digital Platform Services Inquiry Submission – Nov — Amazon Australia’s market position insights
Check what the product measure includes
A supermarket transaction is not a food-only measure. The ABS estimates that, on average, between $70 and $80 of every $100 spent in supermarkets is food; the remainder can include products such as cosmetics, pet food, alcohol and household goods. A supermarket turnover result and a household food-spending result therefore describe different parts of the same purchase.
The Monthly Household Spending Indicator (MHSI) is designed to estimate household consumption, not a retailer’s sales. It draws on aggregated, de-identified bank card transactions, supermarket transactions and new vehicle sales data. Supermarkets provide weekly transaction files, while new vehicle sales data is supplied monthly by the Federal Chamber of Automotive Industries.
The ABS says these data sources are not designed for statistical purposes and their coverage differs from Household Final Consumption Expenditure and retail turnover. The MHSI is benchmarked to annual Household Final Consumption Expenditure and adjusted monthly to cover gaps such as cash spending. Its estimates are therefore a view of household consumption, not a complete record of every transaction.
Top Product Categories in Supermarket Spend (Estimated Share)
- AlcoholEstimated share of non-food supermarket spend
- Cosmetics & personal careEstimated share of non-food supermarket spend
- Pet foodEstimated share of non-food supermarket spend
- Household goodsEstimated share of non-food supermarket spend
Compare on a compatible basis
Record the category, geography, periods, unit and seasonal adjustment beside each figure. Check the latest release for revisions. Current-price spending reflects prices and measured volume; a monthly dollar movement is not an item count. Where a matching quarterly chain-volume series is available, it can help assess price-adjusted movement, but it does not count one retailer’s units.
A category total can also hide changes in products or purchase timing. Before committing to a range or stock change, examine the relevant products and the retailer’s own sales and availability records.
Match the geography to the decision
The MHSI publishes data for Australia and for states and territories. Choose the level that matches the decision, and do not treat a national result as evidence that every state, territory or local customer group moved in the same way.
The MHSI aims to align with household final consumption: spending by Australian resident households on goods and services for their own non-commercial use. Its bank card data excludes transactions in foreign currencies where the card terminal is outside Australia, and its sources do not capture resident spending on goods and services offered outside Australia. Keep these boundaries in view when describing a result as Australian household demand.
Make a bounded decision
State the observed movement, its population and period, and what it supports. A national household spending result can establish a movement in its published category, but it cannot establish a retailer’s basket composition or customer motives.
Turn the result into a testable next step
For a retailer decision, list the products and customers in scope, then check the retailer’s own sales and availability records for that group. A published category estimate can flag a movement to investigate, but its product boundary may not match the proposed range.
Write down what evidence would confirm or weaken the proposed explanation, and set a review period that fits the decision.
In this guide
- Comparing grocery shopping with discretionary retail demandCompare Australian grocery and discretionary demand using suitable category boundaries, purchase behaviour and matched evidence.
- Understanding different purchase cycles across retail categoriesIdentify replenishment, replacement and occasion purchases, then measure retail purchase cycles without confusing seasonal sales with repeat buying.
- Reviewing category data before drawing a market conclusionAudit category definitions, periods, price basis, revisions and alternative explanations before using Australian retail data in a market conclusion.
- Identifying a category trend with limited evidenceDistinguish a short-run retail category signal from a sustained trend, and state what further Australian data would test the claim.